Translated from the original article published on ifgeekthen by NTT DATA Spain
Just when you think you’ve seen it all in the technological field, something new comes along and revolutionizes the web. This concept that has given a lot to talk about in recent years is Web Performance Optimization.
You are probably thinking, and you will not be wrong, that web performance has been with us for a long time, but since Google introduced its PageSpeed Insights tool in 2010, it has become even more popular in the development of all major modern websites.
What is Web Performance Optimization?
The term Web Performance Optimization (WPO) is the optimization of the loading times of a web page, i.e., it tries to reduce the period that elapses from the time a user accesses the page until the content is fully displayed and the user can interact with it.
So… Why is WPO so important?
Nowadays, having a website that loads fast is one of the most important SEO (Search Engine Optimization) techniques. Google considers that loading speed is an essential element in improving the user experience, rewarding all those websites with quality code and good performance. According to several studies (editor’s note: compare Think with Google and Akamai, other studies by Aberdeen and Gizmo are not available anymore), a loading time of no more than 3 seconds is optimal.
Therefore, by improving the loading speed of a website, a great user browsing experience is achieved, which has a direct impact on an increase in traffic and search engine rankings.
How web page speed optimization influences conversions
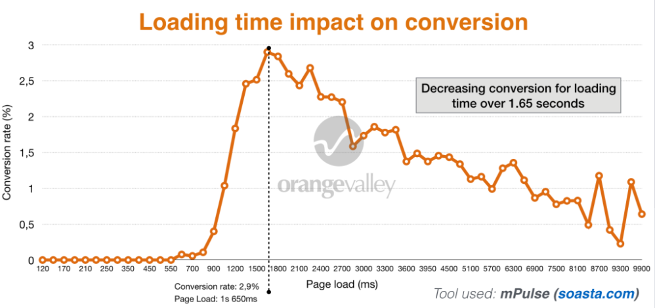
A page that takes 3 seconds or more to load is of no interest to most users and will likely end up being abandoned. The impact of loading speed will result in a lack of active users and they will not reach the conversion point.
There are experiments that show that almost 50% of the users of a website expect it to load in less than two seconds. Based on this study, we can say that a website that takes three seconds or more to load will lose approximately 40% of its consumers.
This reality check that most websites face can mean millions of dollars in losses for a company.
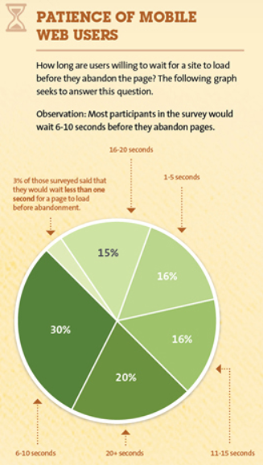
In another study, we can see how for those users who stayed on a website with long loading times and slow navigability there is up to an 80% chance that they will not return to this website again.
Improved indexing in SEO positioning. Visibility
As we have seen, if users do not reach the conversion point, Google will determine that the website does not offer relevant content and will have a negative impact on SEO, without appearing among the first searches. On the contrary, having an optimized web page implies that all the metrics that Google uses to index a website are obtained in a shorter time, facilitating the indexing in a browser.
We must take into account that most users who consume the content of websites do so through mobile devices. In December 2017, the Google search engine began ranking all results according to mobile versions of pages, rewarding those website search results that work best on mobile devices.
Why is a website slow?
In recent years, due to the high impact caused by the loading speed of a website, many companies and developers in general, have invested time and money in generating studies, tools and methodologies to analyze the performance of a website. Using these we can figure out the reason, why a website is slow, which can be due to anything from server load time, images with a large size or even the amount of redirects you have.
A good loading time is…
Before carrying out a study that can improve the WPO it is important to previously establish some objectives that mark the scope. Establishing what is an acceptable loading speed, and even more important, what it is according to our sector.
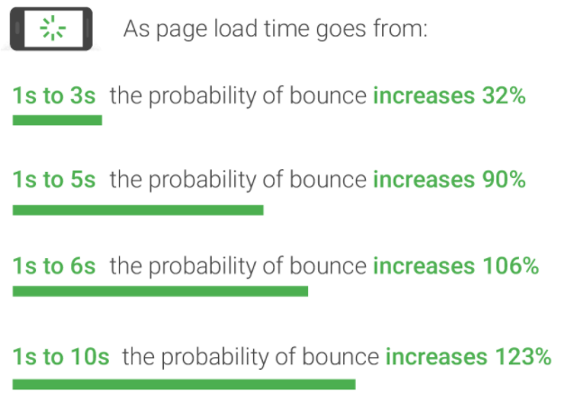
Google considers that a loading time of more than three seconds can be fatal. The company has published a generalized study by sector , where we can see that unfortunately the current reality is very different. Although in recent years the average has been reduced by about 7 seconds, we are still far from the 3-second barrier. This means that companies are losing large numbers of users and therefore money.

It is important to know that as load time increases, the probability of a user bouncing is high.
Tips for optimizing website performance
As mentioned above, there is an infinite number of factors that influence the slowness of a website. Next, we are going to see some very useful tools that will allow us to analyze the performance of our website and lateron, possible solutions to address the different problems that can cause as a counterpart a low performance.
Before starting, it is necessary to know the current state of the web performance. To do this, you can use a series of both free and paid tools, which generate a very complete report on its recent state, and some of them even report suggestions on how to mitigate the problems detected.
Website speed test
Some of the tools that test the loading speed are:
- WebPageTest: Generates a complete report about the loading speed. Its strong point is that it supports the analysis of websites that implement the HTTP/2 protocol, a protocol that increases the loading of web pages up to 60%.

- PageSpeed Insights: This is Google’s tool par excellence for WPO optimization. It is easy to use and generates a complete report on the current state of web performance. The most interesting thing is that it shows a series of indications, with very useful information, on how to solve the detected problems. PageSpeed is based on Lighthouse data, which will be discussed later.
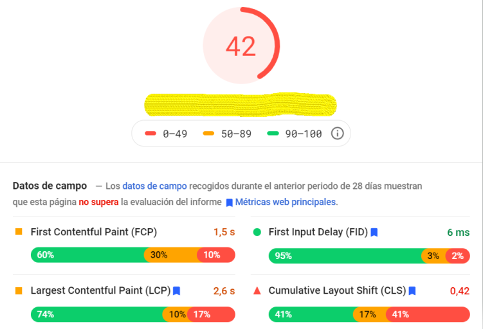
- Pingdom: Pingdom is one of the most powerful tools that offers a complete report detailing which are the elements that affect performance and how they can be solved in the best way.
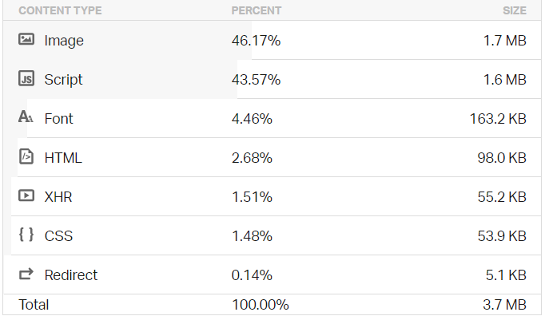
- GTMetrix: GTMetrix is another must-have tool thanks to its incredible load speed analysis, prioritized by priority order, and customized recommendations to mitigate problems.
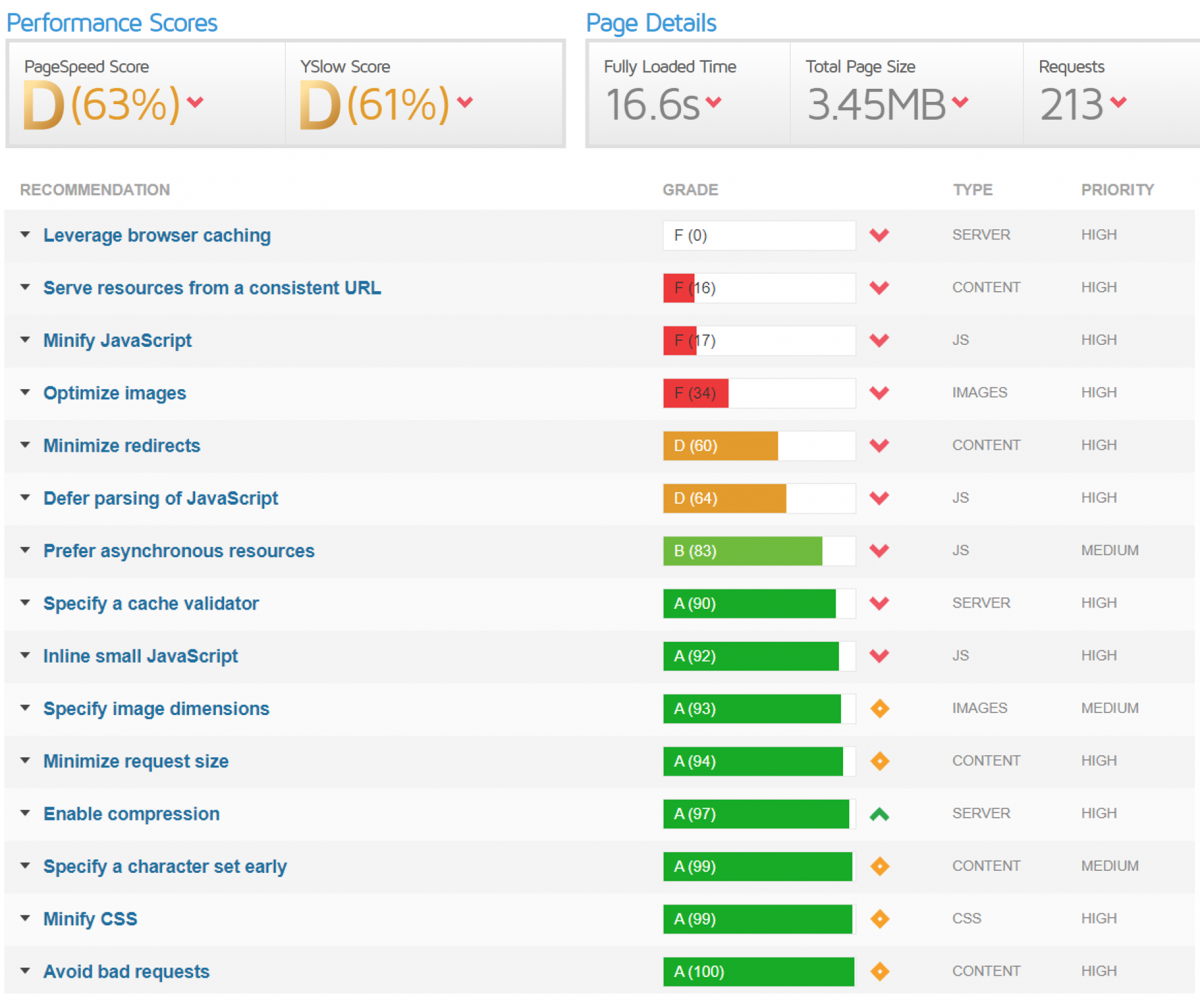
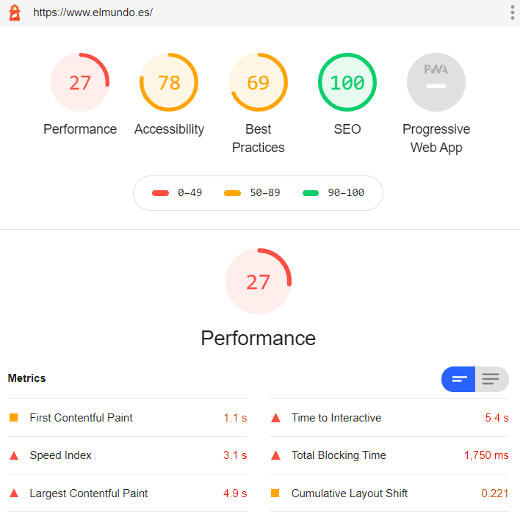
- Lighthouse: This is an open source, developer-oriented, automated tool for improving the performance, quality and correctness of your applications.
In order to see where the bottleneck is located, you can complement the speed tests you perform on a website with load tests. Let’s take a closer look at some of the more advanced tools:
- CyberFlood is ideal for security and performance testing.
- Load impact is for automated and on-demand performance testing for DevOps.
- Loader is perfect for testing APIs with thousands of simultaneous connections.
- BlazeMeter stands out mainly for massively scalable performance testing at every software stage.
Image optimization
Did you know that the main problem of loading a website is the size of the images? Using compression tools without losing image quality, such as TinyPng, is an excellent idea to choose the right size for them.
Although images play a very important role in the loading of a website, it does not mean that we should use few or directly eliminate them. This can be counterproductive because, according to some studies, on e-commerce websites, users expect to see at least three images before buying a product (editor’s note compare Salsify, and in Springer the influence of images was studied).
Loading an image in high resolution and then limiting its size through CSS is a bad practice that is often carried out. When this habit transcends to a web page, the entire image is loaded first and then resized to the appropriate size, slowing down the page.
One of the easiest ways to reduce the size of images is to adjust it to the correct size, so that if you want an image to appear 360px wide, resize the image to that width. Although this use is difficult to do when the website is fully responsive, you would have to upload in this case a specific image for each breakpoint.
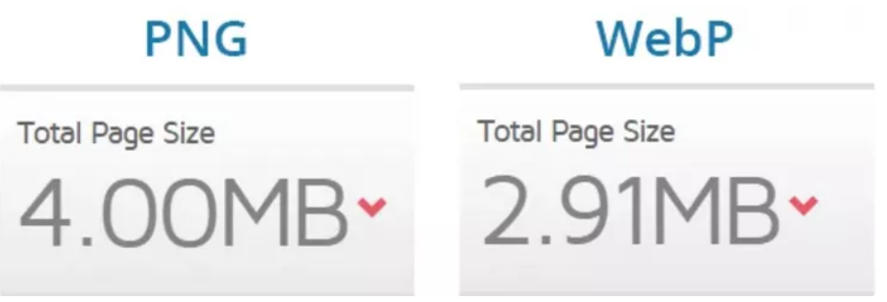
It is even advisable to use image formats such as WebP which, as of October 2020, are supported by all browsers except Internet Explorer. When this format is used, it is possible to compress the size of images by an average of 25% without losing quality.
Reduce HTTP requests
Normally, when your browser obtains data from a server, it uses the HTTP protocol. Therefore it should be noted that the more times you request information from the server, the more HTTP requests there will be, causing the loading to be slower.
It is important to analyze all the requests that are being made, because add-ons such as plugins or libraries that are being used send a high number of them, and maybe not all of them are strictly necessary. In this case it is interesting to find an alternative to solve the problem.
Minifying Javascript, using CSS Sprint, avoiding plugins, having a clean and refactored code, are some of the ways to reduce the weight of this amount of requests.
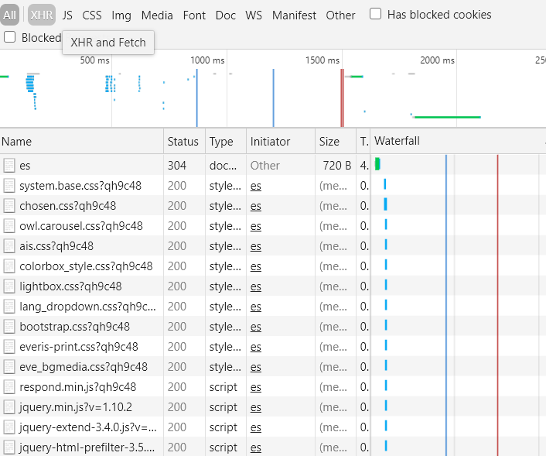
In the browser development tools we can get an idea of the requests that our website is consuming.
Minimize CSS and Javascript
Now that we know how to detect the request requests made by the website, you can start to minimize those related to CSS and Javascript.
This can be done by using comments, block delimiters and unifying the code into a single, less cumbersome file. This practice has two main advantages, which are to reduce the number of requests and to reduce the total download size. There are different methods to minify the code and it is up to you to use one or the other depending on each individual project.
Code quality
The quality of our HTML, CSS and JS code is one of the issues that cannot be overlooked. Making a quality, accessible, reusable and scalable code will avoid, among other things, unnecessary external calls, high temporal and computational complexities that cause saturation in the server or the user’s browser.
TTFB
An essential measure to take into account is the time to first byte or TTFB. It is the amount of time a browser has to wait before getting the first byte of data from the server where the website is hosted. For Google, it is very important as a critical performance measure, recommending that the TTFB should be less than 200ms.
When a user requests information from a website in his browser, he sends an HTTP request to the server where it is hosted. Typically, there are three steps that occur between the initial request and the first byte of data:
- Server lookup via DNS.
- The server processes the requested information.
- The response in your browser.
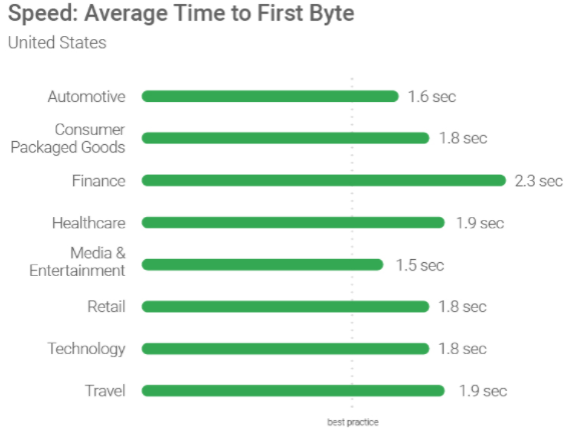
To access this information we can do it through Google’s developer tools in your browser or others like the previously mentioned WebPageTest.
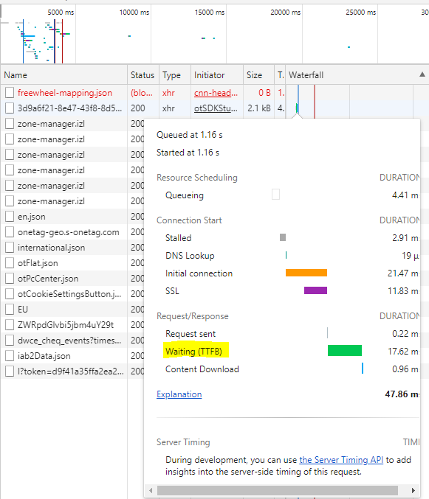
A high TTFB is usually due to network problems, a bad configuration of the dynamic/asynchronous content, the configuration or performance of the web server. Also in many cases, using a CDN or a more efficient DNS can lower TTFB.
Reduce redirects
Redirects are common in web development, but having too many of them can create additional HTTP requests, negatively affecting loading speed, particularly on mobile devices. This means it is best to keep them to a minimum. In fact, Google says that sooner or later they will be removed for good.
HTTP/2
This protocol arrived on the market to make way for its previous version HTTP/1.1, bringing numerous improvements such as the use of a single connection, header compression or the “server push” service.
In many analyses, the adoption of this protocol is recommended as one of the first options to improve web performance, since it provides improvements of up to 60%. Using the Go programming language they performed a test to see the differences between version 1 and 2 of this protocol (editor’s note: compare the improvement in waiting time reported by DebugBear and the benchmark results by http2benchmark). Here you can see it better (editor’s note: As gophertiles has been discontinued, have a look at the demo by imagekit.io).
To enable this protocol, you need an SSL certificate and a server that supports HTTP/2. To check if your website supports this protocol use this tool.
In 2019, the successor was presented, with the name HTTP/3, promising significant improvements. I’m sure it will bring goodness to improve WPO!
Enable Gzip compression
Gzip is a form of compression for web pages, CSS and JavaScript at the server level before sending them to the browser. This website performance optimization is easy to implement, and can make a big difference by greatly reducing the final file size. It is highly recommended to employ this practice whenever possible.
CDN
A CDN (Content Delivery Network) is a set of servers located in different points of a network, which contain local copies of the website and allow to divide the global traffic among all those servers reducing the latency (less distance), thus avoiding the saturation of the main server.
A very common occurrence is to experience high levels of traffic at very specific moments in time. This will result in server saturation, resulting in sub-optimal performance for end users - remember that high load times mean high monetary losses!
In addition, for users who are geographically far away from the server, load times are longer as the information has to travel a greater distance.

In several case studies, it is estimated that the gain in load time is between 20% and 50% and in addition using this technique reduces saturation on the main server (editor’s note: compare the articles on loadforge.com and ventureharbour.com).
The use of a CDN requires its own study for the type of web, number of users that consume its content and from where geographically speaking.
Conclusions
Improving the performance of our website can bring us numerous benefits. Using the different analysis tools we can obtain a series of recommendations that, in many cases, will be sufficient to obtain the expected results. If we want to delve even deeper into the issue and achieve very ambitious goals, there are several techniques that we can use.
It is advisable to dedicate some time to first identify the critical points that report a greater benefit in loading times. From there, we can look for easy points that, although they may seem minor, can lead to easy gains.
Do not forget that one second of load time can make the difference.
Credits
Title image by optimarc on Shutterstock
The original article has been published in Spanish on the blog ifgeekthen by NTT DATA Spain.

